In early October 2017, several weeks after Hurricane Maria devastated Puerto Rico, the Maxar team was asked to provide geospatial data and analytics to support a critical relief operation scheduled to happen within the next 48 hours. The mission was to deliver much-needed supplies by ground and air to one of the hardest-hit rural areas, a mountainous region in the center of the island. The ask was for help identifying the towns most severely damaged by the hurricane, mapping debris and blocked roads, and determining the best path to reach those residents in desperate need of emergency supplies.
The team immediately volunteered to assist, knowing that the data would need to be delivered on a tight deadline to be of use to the relief activity. We started by assessing what capabilities and additional resources we could deploy to get the information quickly.
In addition to determining the most-impacted towns and availability of access routes, we focused on identifying:
- Routes for large support vehicles, based on current road conditions.
- Possible helicopter landing zones (HLZs) by aircraft type near towns and emergency services.
- Key points of interest relevant to the mission, such as active medical facilities, gas stations and shelters. This was needed because with the language barrier and lack of a communications strategy, some details reported by local groups were not getting relayed to humanitarian aid groups.
- Current condition of flooded areas, which changed daily because the weather remained problematic. The most current, updated information was essential for both helicopter pilots and ground-based support.
With the clock ticking, we created a plan using our capabilities to synthesize data from a number of sources. First, we launched a crowdsourced data discovery and validation campaign using our crowdsourcing platform. When we mention crowdsourcing, we are almost always referencing a volunteered geographic information (VGI) effort, which is the ability to generate, discover or validate data via consensus. Our crowdsourcing platform also uses a statistical algorithm we call “crowd rank” to aggregate all the user annotations and determine the most relevant and true points.
We shared the most-recent high-resolution imagery collected within that week and asked the crowd to tag damaged structures and debris within a specific area to make our determination of which areas were most damaged by the hurricane.
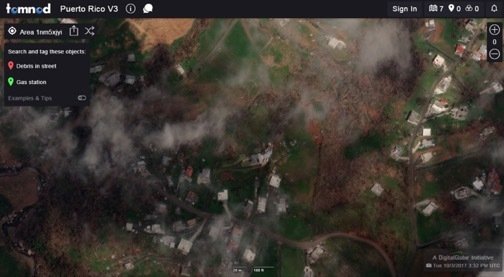
This campaign, launched October 11, asked the crowd to identify road debris and active gas stations.
To get critical ground information, we ran discovery and validation campaigns to verify if gas stations listed as operational were actually open and stocked with fuel. The local media were reporting functional gas stations by town and road intersection. Because this information was fed to the media by word of mouth, it was not getting relayed to relief providers, who needed it to plan outreach efforts. We were able to translate and geospatially reference this against human geography data, and validate by asking the crowd if they saw lines at these locations or no activity.
The final campaign asked the crowd to tag debris or road blockage caused by mudslides. This was an important precursor for our next step: mobility analysis.
It was important to identify infrastructure within the area of interest. To do that, we gathered human geography level data and other reported data from social media, local news and, radio to plot the locations of known and active shelters, hospitals, clinics and fuel stations.
Next, we applied a road density file over the area. We pulled a high-resolution Digital Terrain model produced by Vricon built on relevant imagery, and applied that data to xTerrain—a cloud-based solution powered by high-resolution elevation data that can produce terrain analytics (such as least-cost path, helicopter landing zones, slope analysis) at country scale in seconds. xTerrain can be equipped to generate mobility analysis for specific types of vehicles, or we can input parameters for topics like radiofrequency propagation.
This capability was critical for our success. We could not have performed this sort of terrain analytics over such a large area within the time allotted if we’d used traditional means. Traditional means consist of defining a small area, pulling and downloading data, applying crude cost-surface algorithms from the desktop and waiting―potentially hours―for results, all with fingers crossed that your desktop won’t freeze up. We were able to run these models and gather results within seconds―and have the confidence from knowing the results were based on highly accurate and mission-relevant data. Because of this, we were able to nominate ideal routes and alternate routes for large vehicles and identify potential helicopter landing zones.
Although not a topic of conversation with our end customer, we knew weather was going to continue to be a dynamic factor. For example, while we gathered data, several areas that had dried up were once again flooding as a result of subsequent tropical rain storms. And consequently, debris was once again blocking manmade and natural drainage paths. Roads that were open days prior were once again unpassable. To monitor and adjust our analysis, we applied algorithms to measure soil moisture and flooding to enable us to offer last-minute alternative options.
And key to success, we created a web feature service as a delivery mechanism to push the data and results to both tablets and smart phones in an easy-to-reference manner. This service also included the option to push the files in a very small-size format so that even when crews were in limited bandwidth or disconnected environments, they could access the data. This was particularly critical for pilots and forward personnel.
The comprehensive amount of data delivered as requested in an extremely tight window, and the mission occurred on schedule. Although because of the nature of the mission, it was impossible to gather feedback and hear about the people it aided, the team is extremely proud to have provided relief providers with answers to very difficult logistical questions. The request, data gathering, analytics and delivery all occurred within a 30-hour window—and included a night’s rest. Most impressive, the majority of the work was executed by a single analyst. He was able to perform all these actions because he had access to high-resolution imagery, accurate and relevant data, and to a suite of geospatially relevant cloud-based tools that served as a force multiplier.